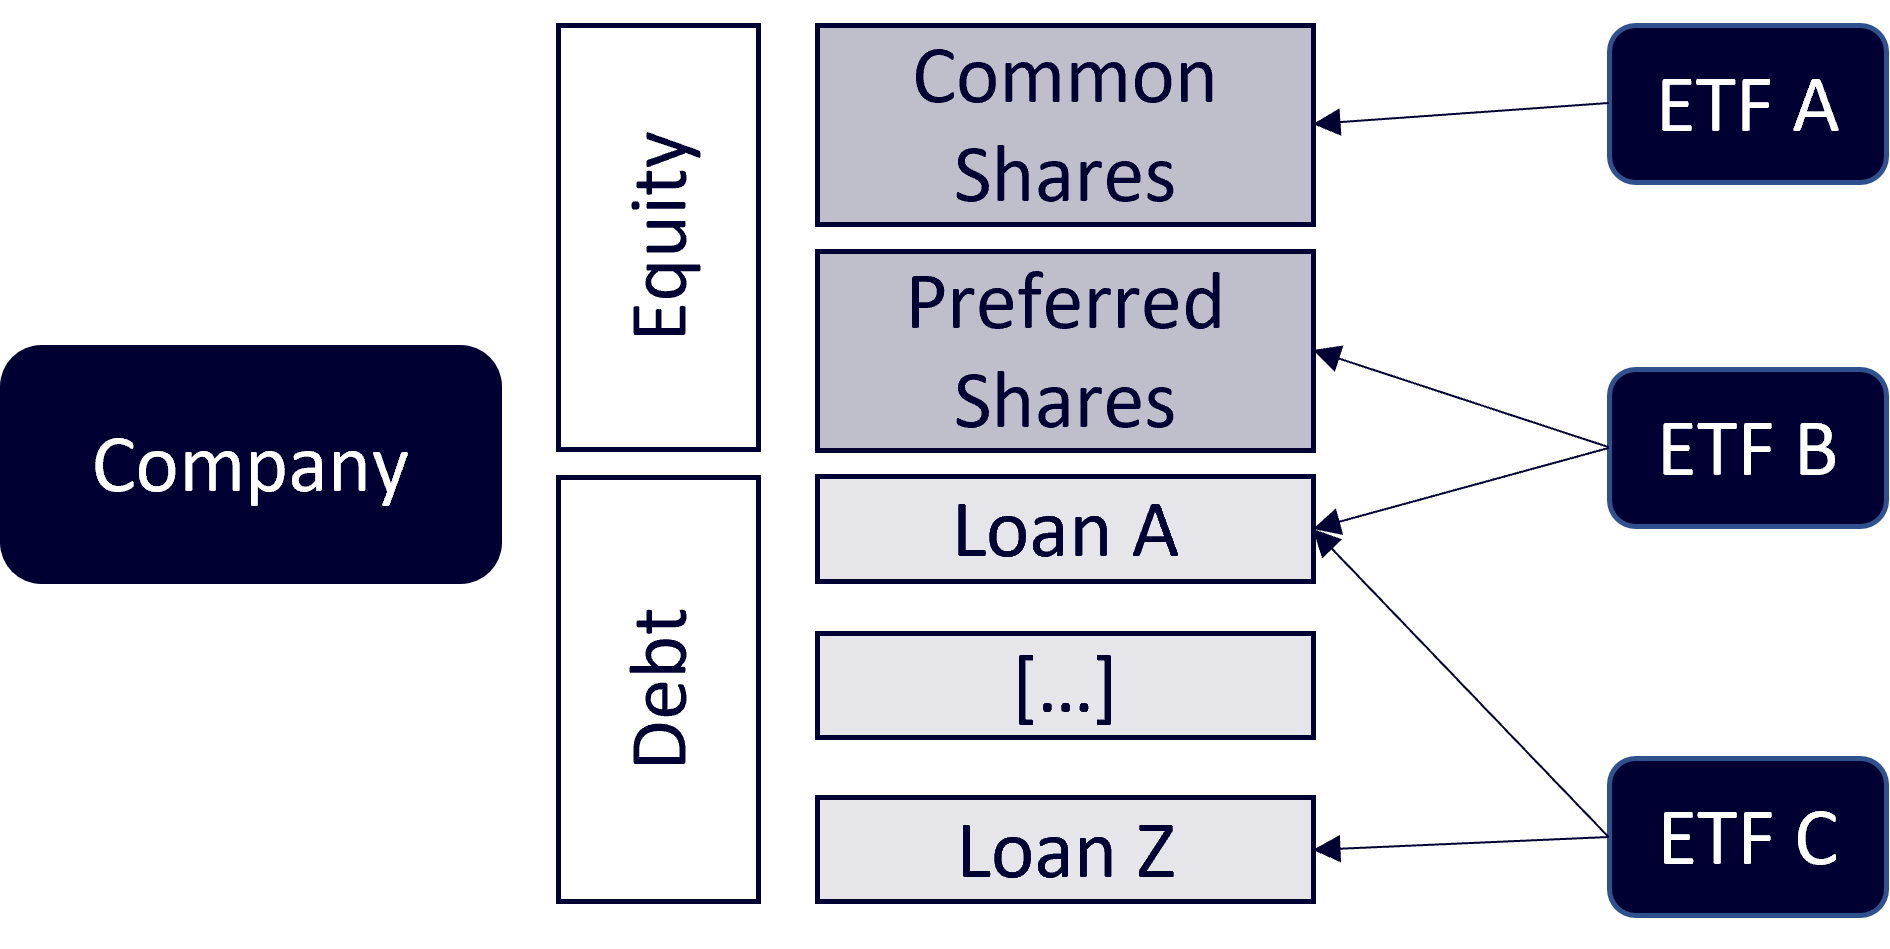
Structure of available ETF Data
To uncover hidden risks in an ETF-Portfolio we need to have a unified database that holds detailed information for ETFs from different providers.
To collect the data from different providers, there arise several hurdles as each data provider can freely choose on how to provide the data (file type), on naming conventions and to some extent also on the dimensions of the data. Within certain limits, providers are free to choose the names and identifiers for their portfolio positions. This makes matching of portfolio positions over different ETFs and providers a cumbersome task.
But why go through all of this trouble, when this data is freely available and should be easily accessible with a data provider?
First, as a EU-citizen I focus the analysis on ETFs available at European exchanges. Most affordable data providers focus on U.S.-listed financial products.
Second, financial data is expensive in general. My target groups for this analysis are private investors saving for retirement and small financial businesses.
(Note: If you know an affordable data provider who provides good quality data for European listed ETFs, please contact me!)
Data structure
ETF portfolio data provides a list of security holdings. To calculate weights and risks across different ETFs, we need data identifying securities and linking them to issuing companies.
There are mainly two types of securities: equity and debt. With holding an equity security, an investor has a right to a share of a company’s profits and (in most cases) also some voting rights. A debt security (e.g. bond or loan) gives the borrower the right to interest payments and the repayment of the principal.
While equity and debt securities cause different types of risk, they are both exposed to the risk of the issuing company. In an ETF-Portfolio, several ETFs can be invested in the same company by holding one or more securities.

Note: This structure can get much more complicated with multicorporate enterprises. One entity can own several companies which separately issue equity and debt securities.
The first step for the database will be to define unique identifiers of companies and securities, and create links. The data needs to provide the information which company issued which securities.
Identifiers
There are identifiers available in abundance. Every setup with a different purpose. For our analysis, we need an international identifier to uniquely identify both securities and the company issuing them.
The ISIN (International Securities Identification Number - ISO 6166) is the industry-standard for identifying securities. Or as the European Commission formulates it more precisely:
“The ISO standard 6166 is the only unique, standardised and internationally recognised identification system for securities.” European Commission, Antitrust Case 39592
The best way to identify a company is the LEI (Legal Entity Identifier); maintained by the Global Legal Entity Identifier Foundation. The GLEIF provides both search tools as well as complete mapping tables (ISIN to LEI) which are updated daily. Available here
Further, the GLEIF provides information on parent and child legal entities if available. This provides the link required to track multicorporate enterprises.
With both the ISIN and LEI at hand to uniquely identify securities as well as companies and link these levels, we need to look which information we receive by the ETF-providers. And how to map that information to an ISIN-LEI framework.
Data availability
In a first step we will look at the largest ETF-Providers in Germany. For each ETF-product, there is a large amount of information available. For now, the focus lies on easy-to-read data. That is: no pdf-files and no web-scraping necessary.
iShares provides an extensive set of information:
- Portfolio Holdings as csv
- Collection of Portfolio Holdings, Statistics, Historic Prices / Shares / Fond Volume and Distributions. The file format is an xml disguised as an xls, which is a bit tricky to extract from. See the data section for more details.
Xtrackers provides similar information:
- Portfolio Holdings as xlsx
- NAV, Index Level and Asset under Management as xlsx
- Distributions not available for download
Lyxor provides all information in same file format:
- Portfolio Holdings as xls
- NAV, Index Level as xls
- Distributions as xls
For details on how to extract and transform the data, please look at the following sections.
Further reading
For different data, please refer to the respective posts that describe how to prepare them:
- Holdings (in development)
- Prices (tbd)
- Distributions (tbd)
- Statistics (tbd)