Availability of security prices
The price of a security is probably the most interesting information, as it provides the information about the current value of your portfolio. But, what exactly is the price of a security? And is there at any point in time only one price?
In fact, the price of a security is nothing more than an observation of the latest executed batch of trades at an exchange. So, by the time you get to know the price, it most likely already changed. Also, it will, at least slightly, be different at several exchanges.
So, the current price is nothing more as a good indication on what might be the price you will pay or receive when you want to buy or sell a security at an exchange.
Nonetheless, it is the best measurement we have at hand to determine the current value of a portfolio. Therefore, let’s have a look at how can we access this information and how it is structured.
OHLCV
Usually, price data is provided as OHLCV. Where OHLCV stands for (Open, High, Low, Close, Volume) and refers to the corresponding metrics of the price observed in a pre-defined period.
For hourly prices, for example, OHLCV defines:
- Open: The price at the beginning of the hour
- Close: The price at the end of the hour
- High: The highest price observed during the hour
- Low: The lowest price observed during the hour
- Volume: The number of stocks traded during the hour
All of these metrics hold important information. The closing price references the last observed price in a period, which is usually referenced to the current price.
The highest and lowest observed prices during a period are the basis for estimating price volatility during a period. And the volume can indicate the strength of a market.
Prices are calculated whenever a trade is settled. For very liquid securities this can mean a fraction of a second. For mutual funds, on the other hand, prices are calculated once a day and reflect the current market value of the fund’s holdings.
Though, any of these numbers can only indicate your portfolio’s possible current value. When you sell all of your assets at once, you will not receive your portfolio’s current value. You need to subtract transactions costs, factor in the bid-ask spread, calculate capital gains taxes and accept lower prices to actually sell your shares.
Symbols and Exchanges
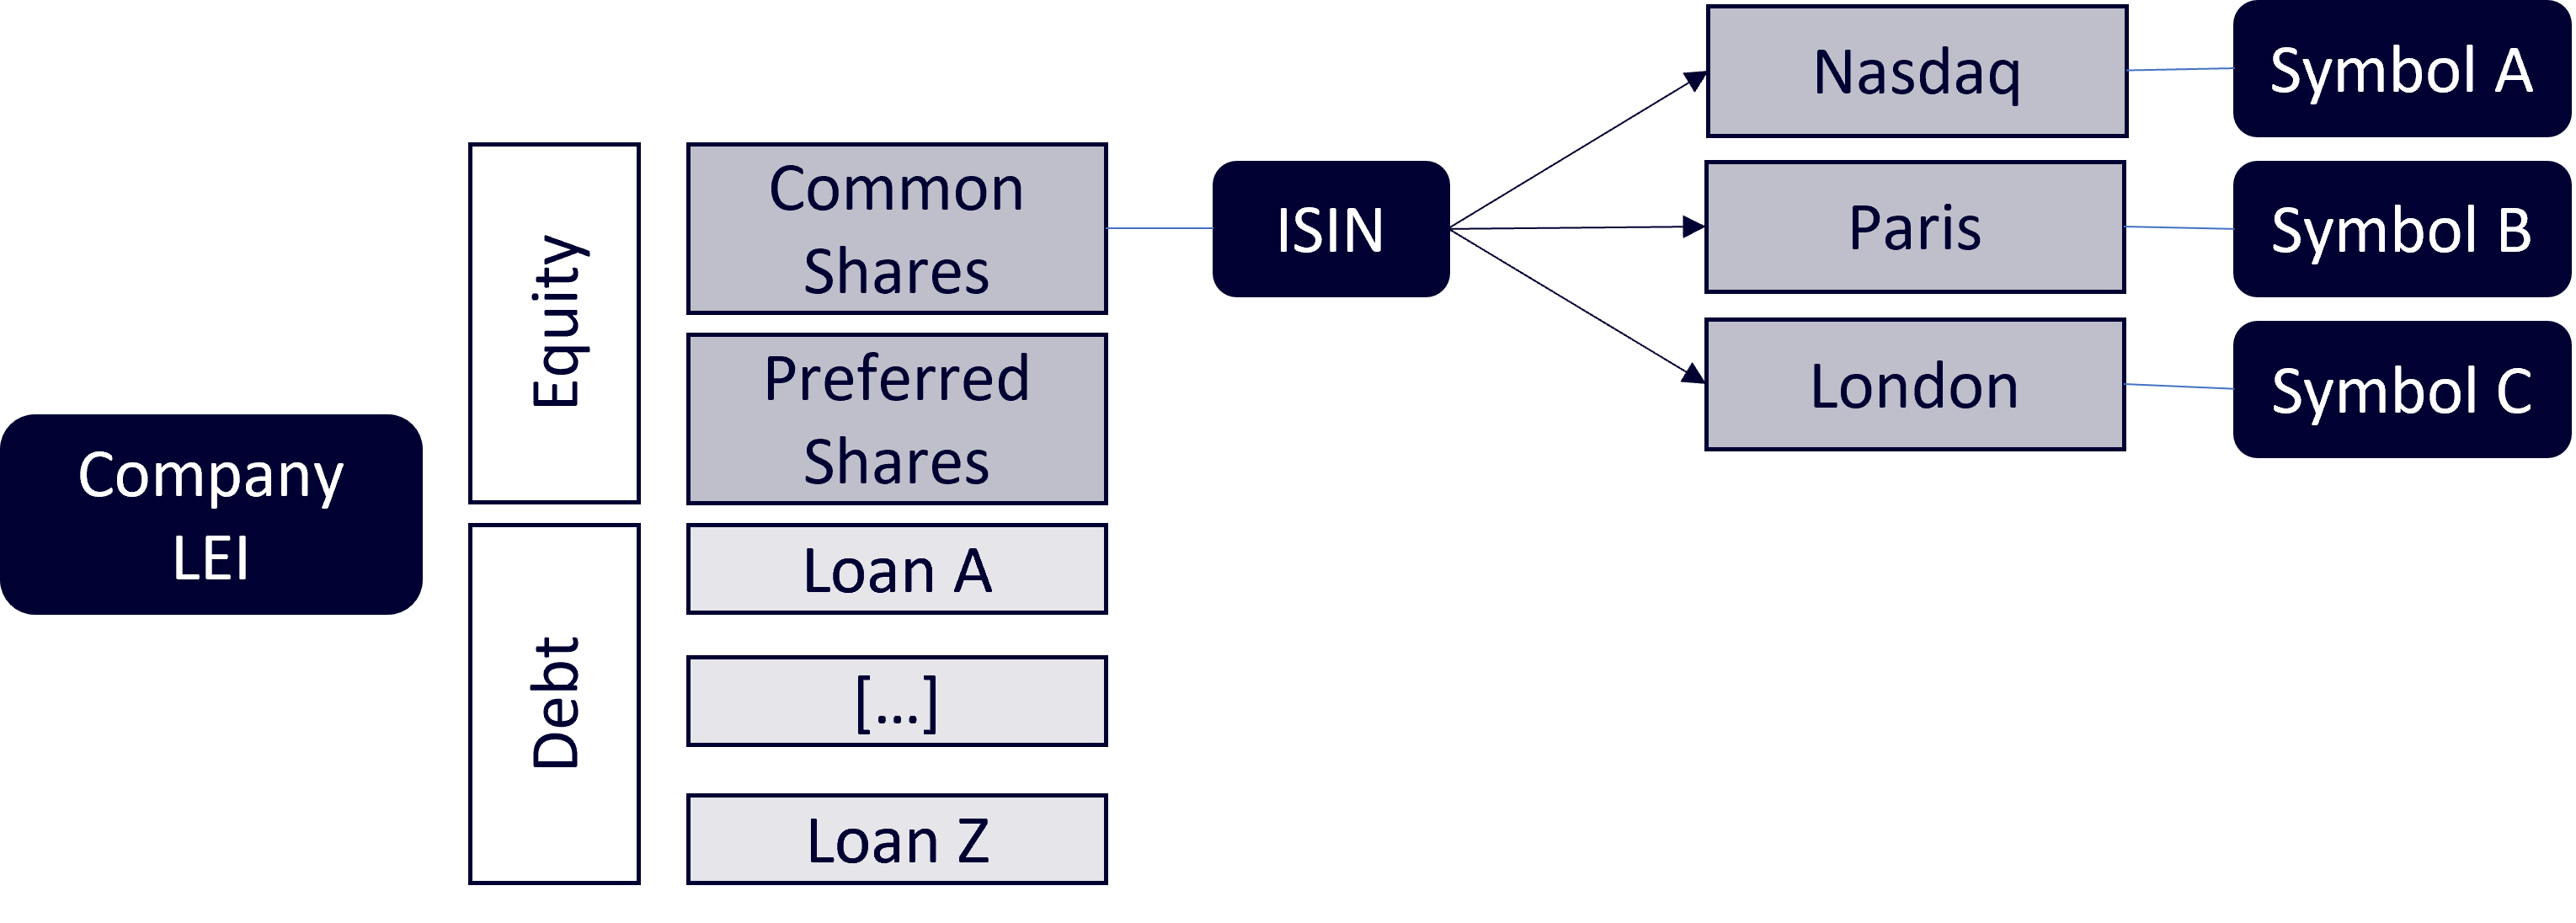
So far, we identified securities with an ISIN, which uniquely and universally identifies a specific security. For accessing the prices of a security, you need to know under which symbol it is listed at a certain exchange. And how your data providers might adjust those.
For example, to access the prices of the Apple Inc. common stock security at the Nasdaq on YahooFinance, you use the symbol “AAPL”. To know the price at Frankfurt Exchange, Germany, the symbol is “APC.F”. And in Sao Paulo, Brazil, it is “AAPL34.SA” .

Now, there arise at least two questions:
- Which one is the correct price?
- How to decide which symbol I need for which analysis?
Following the principle of “No Arbitrage”, all prices should be similar after accounting for exchange specific costs and currency conversion costs. Then, the best symbol is either:
- The symbol at your preferred exchange
- The symbol at the most liquid market
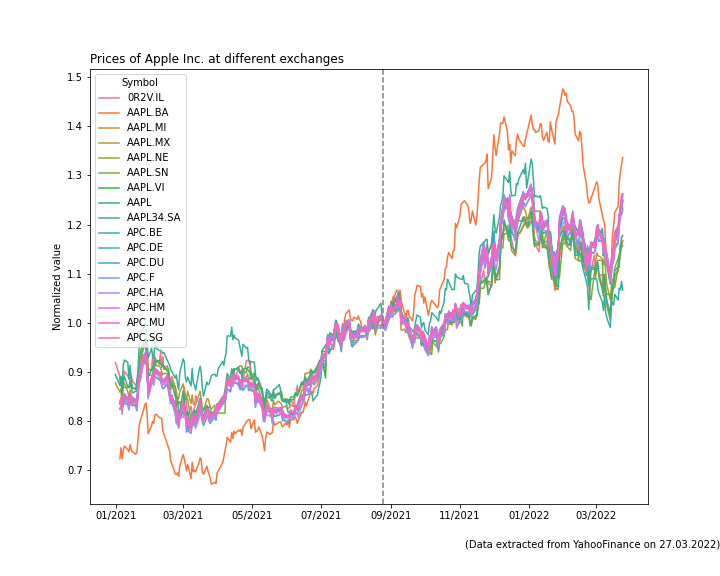
To continue with the example of Apple Inc., whose main exchange is the Nasdaq, I collected some symbols from different exchanges. As the security is listed with in different currencies at different exchanges, I normalized the price data.
Except for the prices at a Brazilian exchange in Buenos Aires with the symbol “AAPL.BA”, most prices behave very siliar over time and are in line with the prinicple of “No Arbitrage”.

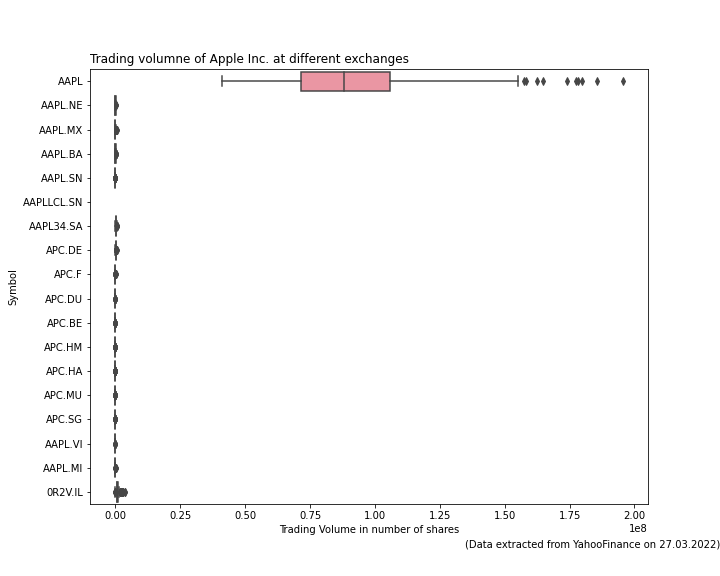
When looking at the trading volume, it becomes obvious that for Apple Inc. the Nasdaq with the symbol AAPL is the main exchange. The trading volume at all other exchanges is negligible.

Summary
For each security, we need to find symbols at liquid markets to get accurate pricing information. Unfortunately, this task has a large amount of manual steps. With the yahoo finance apis, the mapping can be automated only to some extent. Hopefully, in the future, there will be some automated way provided by some paid (and affordable) data provider. There are some affordable ones who provide this mapping functionality, but almost exclusively for US exchanges.